
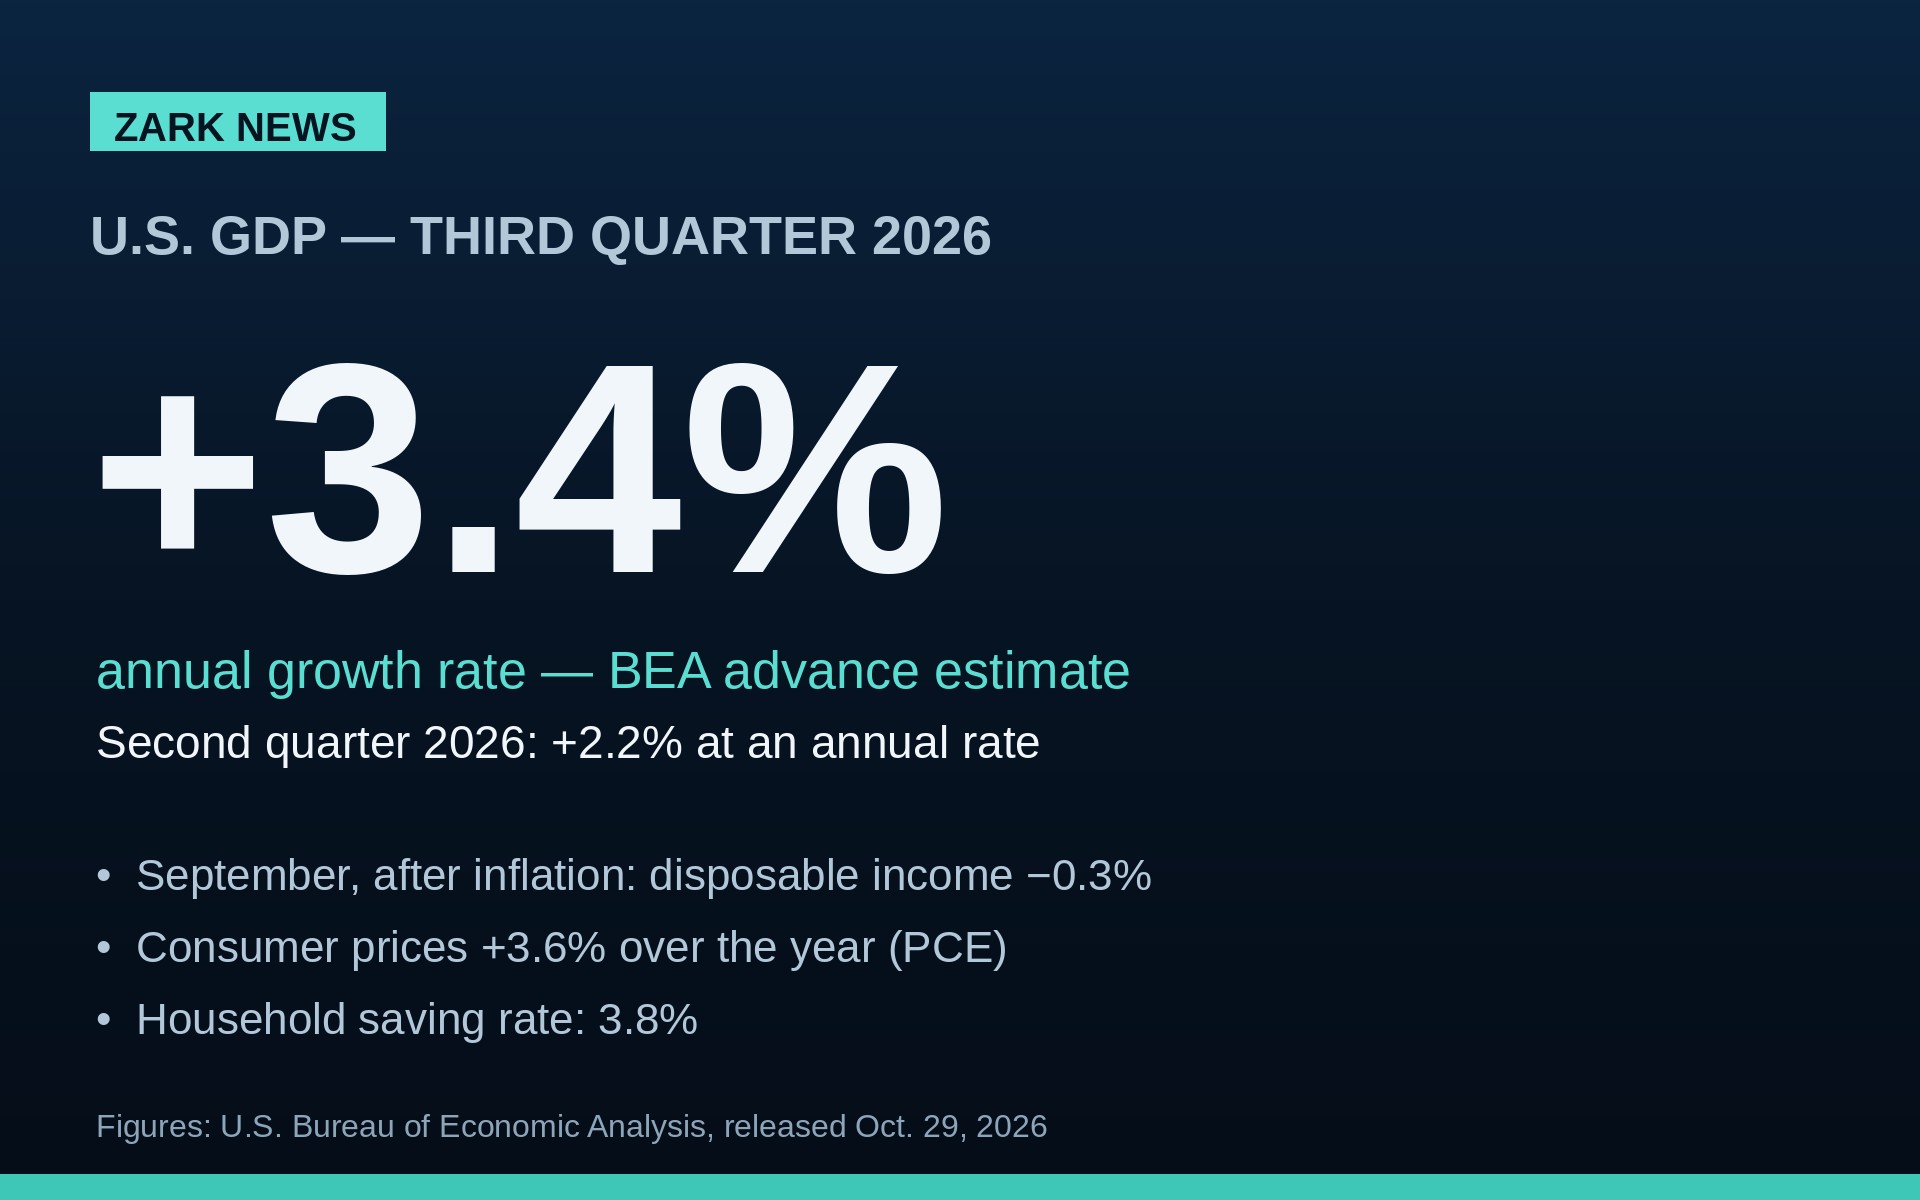
WASHINGTON — The U.S. economy grew at a 3.4 percent annual rate from July through September, faster than the spring quarter’s 2.2 percent pace, the Bureau of Economic Analysis (BEA) said Thursday in its first estimate for the quarter. Shoppers kept spending, businesses spent heavily on equipment and stock, and government spending rose again.
A second BEA report, also released Thursday, tells a quieter story about the quarter’s last month. In September, after adjusting for rising prices, Americans’ take-home income fell, spending barely moved, and prices were still 3.6 percent higher than a year earlier. Both reports can be true at once. The difference is mostly timing, and what each one measures.
What “annualized” and “advance estimate” actually mean
Gross domestic product, or GDP, is the total value of goods and services the country produces. BEA does not say the economy grew 3.4 percent in three months. It says growth was about 0.8 percent during the quarter, converted into an annual rate: if that speed continued for a full year, growth would total about 3.4 percent. Like a speedometer, which reads miles per hour even on a ten-minute drive, the 3.4 percent is the speed, not the distance covered.
This is also only the first of three official readings. BEA calls it the “advance estimate” because some source data are still incomplete. A second estimate is due on November 25, and a third follows. These numbers do get revised, so Thursday’s figure is a good early picture, not the final word.
What drove the quarter
BEA said the increase came from investment, consumer spending, and government spending. A fall in exports took some growth away, and imports rose, which also subtracts from GDP in BEA’s math, since goods made abroad are not U.S. production.
Consumer spending rose at a 3.8 percent annual rate, across both services and goods. Health care led services, mainly hospitals and outpatient care, followed by meals out and hotel stays. Prescription drugs led goods. Much of the quarter’s consumer strength, in other words, came from needs rather than treats.
Business investment did much of the new work. Companies built up inventories, especially in wholesale trade and manufacturing, and bought more equipment — above all information processing equipment, mainly computers and related gear. Many analysts link that surge to the build-out of artificial intelligence and data centers. BEA itself publishes no “AI share” of growth; it records the equipment, and the AI connection is an interpretation analysts and news reports, including the Associated Press, place on those figures.
Housing was the clear weak spot. Residential investment fell at a 3.3 percent annual rate after rising the quarter before, and the Associated Press reported it has now fallen in six of the last seven quarters, squeezed by high mortgage rates. Government spending rose, led by federal nondefense spending, though BEA notes part of that pattern reflects oil sales from the Strategic Petroleum Reserve, with no direct effect on GDP itself. One measure BEA highlights — real final sales to private domestic purchasers, consumer spending plus private fixed investment, leaving out government, trade and inventories — rose 4.9 percent, a sign underlying private demand was firm.
September: the household picture, measured differently
The September report covers one month, not a quarter, and measures household income and prices rather than total production. The two sets of figures answer different questions and should not be mixed.
In September, personal income rose 0.2 percent before inflation, helped by pay and by government benefits, mainly Medicare. But prices rose faster than pay. After adjusting for inflation, disposable personal income — money left after taxes — fell 0.3 percent. Consumer spending rose 0.5 percent in dollar terms, helped by a large rise in spending on gasoline and other energy goods. After adjusting for inflation, spending rose by $2.6 billion — less than 0.1 percent, BEA says; its summary table rounds the figure to 0.0 percent. People spent more dollars and got almost nothing extra for them.
Prices explain why. The PCE price index, the inflation measure the Federal Reserve watches most closely, rose 0.5 percent in September and was 3.6 percent higher than a year earlier. Excluding food and energy, which swing a lot, prices rose 0.3 percent in the month and 3.1 percent over the year. Both yearly figures moved up from August and sit well above the Fed’s 2 percent goal. One caution: the GDP report also lists a PCE figure of 2.1 percent, but that is the average pace across the whole quarter at an annual rate — a different measure from September’s 3.6 percent rise over twelve months. They are not in conflict; they are clocks showing different things.
Households also had a thin cushion. Personal saving was $911.1 billion, and the saving rate — saving as a share of after-tax income — was 3.8 percent: for every $100 of take-home pay, Americans as a group put aside less than $4. A strong growth quarter and a tight household month are not a contradiction. GDP counts health care visits, computer servers and oil sales alongside groceries and rent. It does not say who received the income, or whether a family’s pay kept up with its bills.
What happens next
BEA will publish its second estimate of third-quarter GDP on November 25, along with the October income and spending report. Those will show whether the early growth figure holds, and whether September’s squeeze on real income was a one-month event or the start of a pattern. For now, the honest summary is simple: the economy as a whole had a strong summer. The average household, measured in September, did not feel much of it.
Sources: U.S. Bureau of Economic Analysis, “GDP (Advance Estimate), 3rd Quarter 2026” and “Personal Income and Outlays, September 2026,” both released October 29, 2026; Associated Press coverage of the GDP release (consumer spending pace, housing streak and AI framing attributed to AP in the text).