
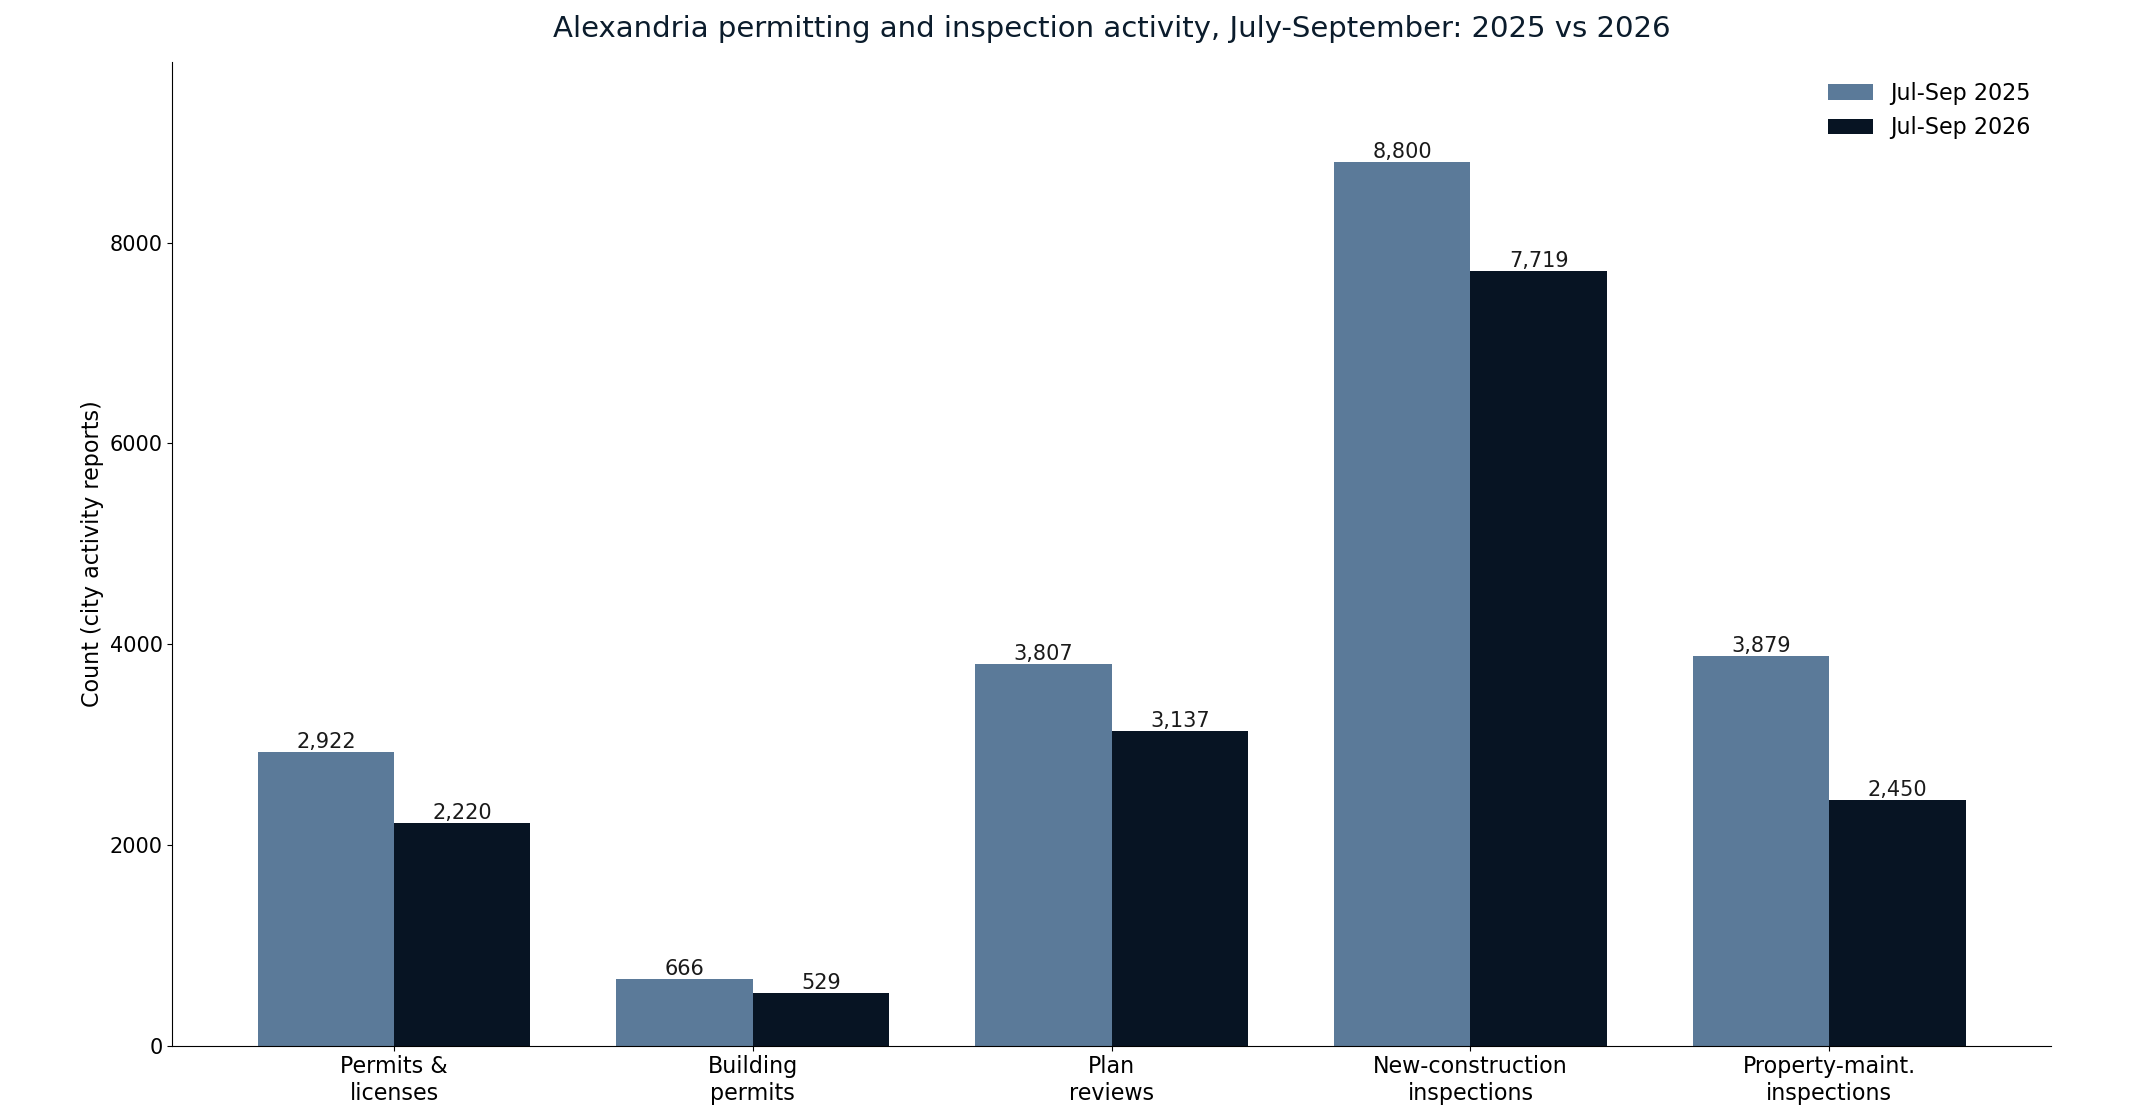
Permits and licenses fell 24% in July through September, while plan reviews declined 18% and new-construction inspections fell 12%. The city’s records do not show whether the change reflects weaker demand, project timing or another cause.
ALEXANDRIA, Va. — Alexandria issued 2,220 permits and licenses during the first three months of fiscal 2027, down 24% from the 2,922 issued during the same period a year earlier, according to a Zark News analysis of the city’s latest Code Administration reports.
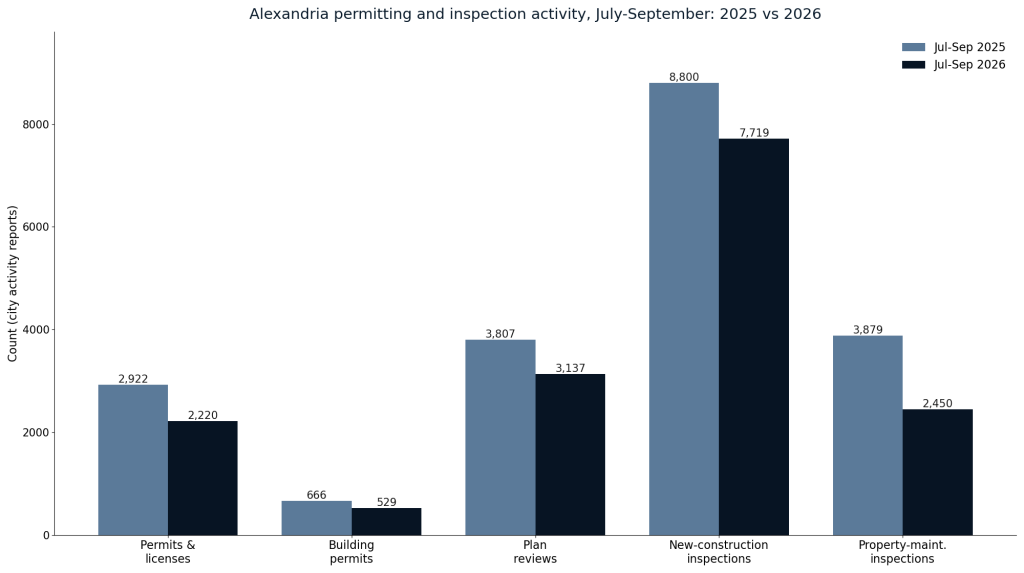
The early decline appeared across several measures of construction and permitting activity. Plan reviews fell from 3,807 to 3,137, an 18% decrease. New-construction inspections declined from 8,800 to 7,719, or 12%. Property-maintenance inspections dropped from 3,879 to 2,450, a 37% decline.
Building permits fell 21%, from 666 to 529. Certificates of occupancy moved in the opposite direction, rising from 52 to 94.
The figures cover July through September 2026, the latest months posted on the city’s public activity-report page when Zark News completed this review on October 27. They measure city workload and completed actions, not construction spending, housing production or permit-processing speed.
The reports therefore establish an early slowdown in recorded activity—not why it happened. Lower totals could reflect fewer applications, the timing and type of projects, staffing or workflow changes, normal monthly volatility, or some combination of those factors.
Zark News sent written questions to the Alexandria Department of Code Administration on October 20, 2026, with a reply deadline of noon on October 22, 2026, and received no response by that deadline. This story will be updated if the department responds.
A change after a higher-volume year
The first-quarter pullback follows a fiscal year in which most of the same measures rose.
For the full fiscal year ending June 30, Alexandria reported 9,358 permits and licenses, 5% more than in fiscal 2025. Building permits increased 25%, to 2,025, while plan reviews rose 9% to 13,118. New-construction inspections increased 14% to 31,047, and property-maintenance inspections rose 30% to 11,185.
The first three months of fiscal 2027 do not erase those annual increases. They show that the city began the new fiscal year below the higher opening-month totals of fiscal 2026.
| Activity | July–September 2025 | July–September 2026 | Change |
|---|---|---|---|
| Permits and licenses issued | 2,922 | 2,220 | −24.0% |
| Building permits | 666 | 529 | −20.6% |
| Plan reviews | 3,807 | 3,137 | −17.6% |
| New-construction inspections | 8,800 | 7,719 | −12.3% |
| Property-maintenance inspections | 3,879 | 2,450 | −36.8% |
| Certificates of occupancy | 52 | 94 | +80.8% |
Percentages in the table were recalculated by Zark News from the city’s published counts. Rounded results match the city’s reported fiscal-year-to-date changes.
Trade permits account for much of the overall decline
The broad permits-and-licenses total includes building permits and several related categories. The largest numerical declines in the quarter came from plumbing and mechanical permits.
Plumbing permits fell from 487 to 300, a decrease of 187, or 38%. Mechanical permits declined from 455 to 250, a decrease of 205, or 45%. Fire-protection-system permits fell 40%, from 184 to 110. Electrical permits declined 9%, from 521 to 473.
Those categories can overlap with the same construction project, so their totals should not be added and treated as a count of distinct developments. A renovation or new building may require separate building, electrical, plumbing, mechanical and fire-protection approvals.
The mix also shifted in the other direction in several smaller categories. Demolition permits increased from 11 to 13. Elevator permits rose from 19 to 43. Certificates of occupancy increased by 42 over the quarter; the city reported 28 in September, the same number as in September 2025, so the year-to-date increase came in July and August.
That increase may reflect projects reaching completion after permits and construction work performed in earlier periods. It does not prove that the broader development pipeline strengthened during the quarter.
Reviews declined, but the data do not measure delay
Alexandria’s public guidance lists a 20-business-day plan-review time frame for commercial and multifamily projects and a 10-business-day time frame for one- and two-family residential projects, unless the work qualifies for walk-through service.
The monthly activity reports count reviews performed. They do not publish the median or average number of days between a complete submission and the city’s initial decision, the number of cases awaiting review, or the share completed within the stated time frames.
As a result, the 18% decline in plan reviews cannot responsibly be described as evidence that the city became slower. The number could fall because fewer plans entered the system, because the projects required different numbers of review cycles or because of changes in workload or staffing.
The largest review-category decline was in “take-in” activity, which fell 43%, from 879 to 505. Site-plan and related reviews fell 33%, from 155 to 104. Permit Center reviews fell 7%, from 2,531 to 2,359.
Those differences reinforce the need for the city to explain what each category measures and whether the early-year figures reflect demand, operations or both.
A new push to digitize permitting
Separately, Alexandria was selected in October for a Bloomberg Philanthropies housing initiative, with prospective support of $450,000 to $750,000, according to the city. The city says it plans to digitize and streamline permitting under the initiative. Bloomberg Philanthropies told The Alexandria Brief on October 15 that Alexandria would adopt the initiative’s faster, digitized permitting approach, modeled on San Diego. The initiative is a future operational effort; the activity reports do not establish that it caused the July–September changes or that it has shortened review times.
Property-maintenance activity also fell
Property-maintenance inspections declined 37% during the three-month comparison. Proactive inspections fell from 2,017 to 819, a 59% drop, while complaint inspections rose 12%, from 1,171 to 1,316.
Residential-rental inspections fell from 292 to 17. That category can be affected by program schedules and inspection cycles, so it should not be interpreted as evidence that rental conditions improved or enforcement stopped without additional information from the city.
Code Administration enforces the Virginia Maintenance Code and local rules involving building conditions, rodents, debris, tall grass, construction noise and other property issues. The department reported 177 maintenance-code violations during July through September, down from 222 a year earlier.
Why the numbers matter
Permitting and inspection activity offers an early, imperfect view of construction and property-regulation work in the city. Building permits can precede construction by months, while inspections occur repeatedly as work advances. Certificates of occupancy generally appear near the end of the process.
Tracking all three helps distinguish a true pipeline change from a single-month swing. The current data point to less activity across several stages, alongside a sharp increase in occupancy certificates issued.
What the records cannot yet determine is whether Alexandria is seeing a short pause after a busy year, a change in the mix of projects, or the beginning of a more sustained slowdown.
What happens next
October’s report will add a fourth month of fiscal 2027 data. Zark News will also ask the city for application counts, pending caseloads and review-time performance, which would show whether lower output reflects lower demand or a growing backlog.
The key test is not simply how many permits the city issues. It is whether complete applications are reviewed within the published time frames and whether residents and businesses can move through the process consistently.
Methodology and limitations
Zark News compared the fiscal-year-to-date columns in Alexandria Code Administration’s September 2026 activity report with the prior-year totals published in the same report. The June 2026 report supplied the full-year fiscal 2026 comparison.
September’s cumulative totals are used as published. They do not exactly match the August year-to-date figures plus September’s monthly counts in every category — total plan reviews are 3,137 as published, rather than 3,169 by that addition — which indicates that cumulative figures may be revised between reports. The reports do not state a reason, and the difference does not change the direction of any measure in this story.
The analysis counts administrative actions, not unique projects. A single development may generate several permits, reviews and inspections. The reports may also be revised. Three months are insufficient to establish a durable trend, and the data do not measure construction value, housing units, pending applications or review duration.
No private applicant information was used. The analysis relies only on aggregate city totals.
Primary sources: Alexandria Code Administration monthly reports — September 2026 activity report; June 2026 activity report; Plan Review Services and published time frames; City of Alexandria, Bloomberg Philanthropies housing initiative announcement, October 16, 2026.